


Boiler drift hides inside monthly fuel reports.
Small inefficiencies compound into major fuel waste.
HeatOptx turns invisible industrial heat waste into thermal maps, detected anomalies, and ROI-backed repair decisions.
Industrial Thermal AI
HeatOptx maps thermal losses across boilers, pipes, heat exchangers, and process lines, detects anomalies, and ranks every fix by ROI.

The problem
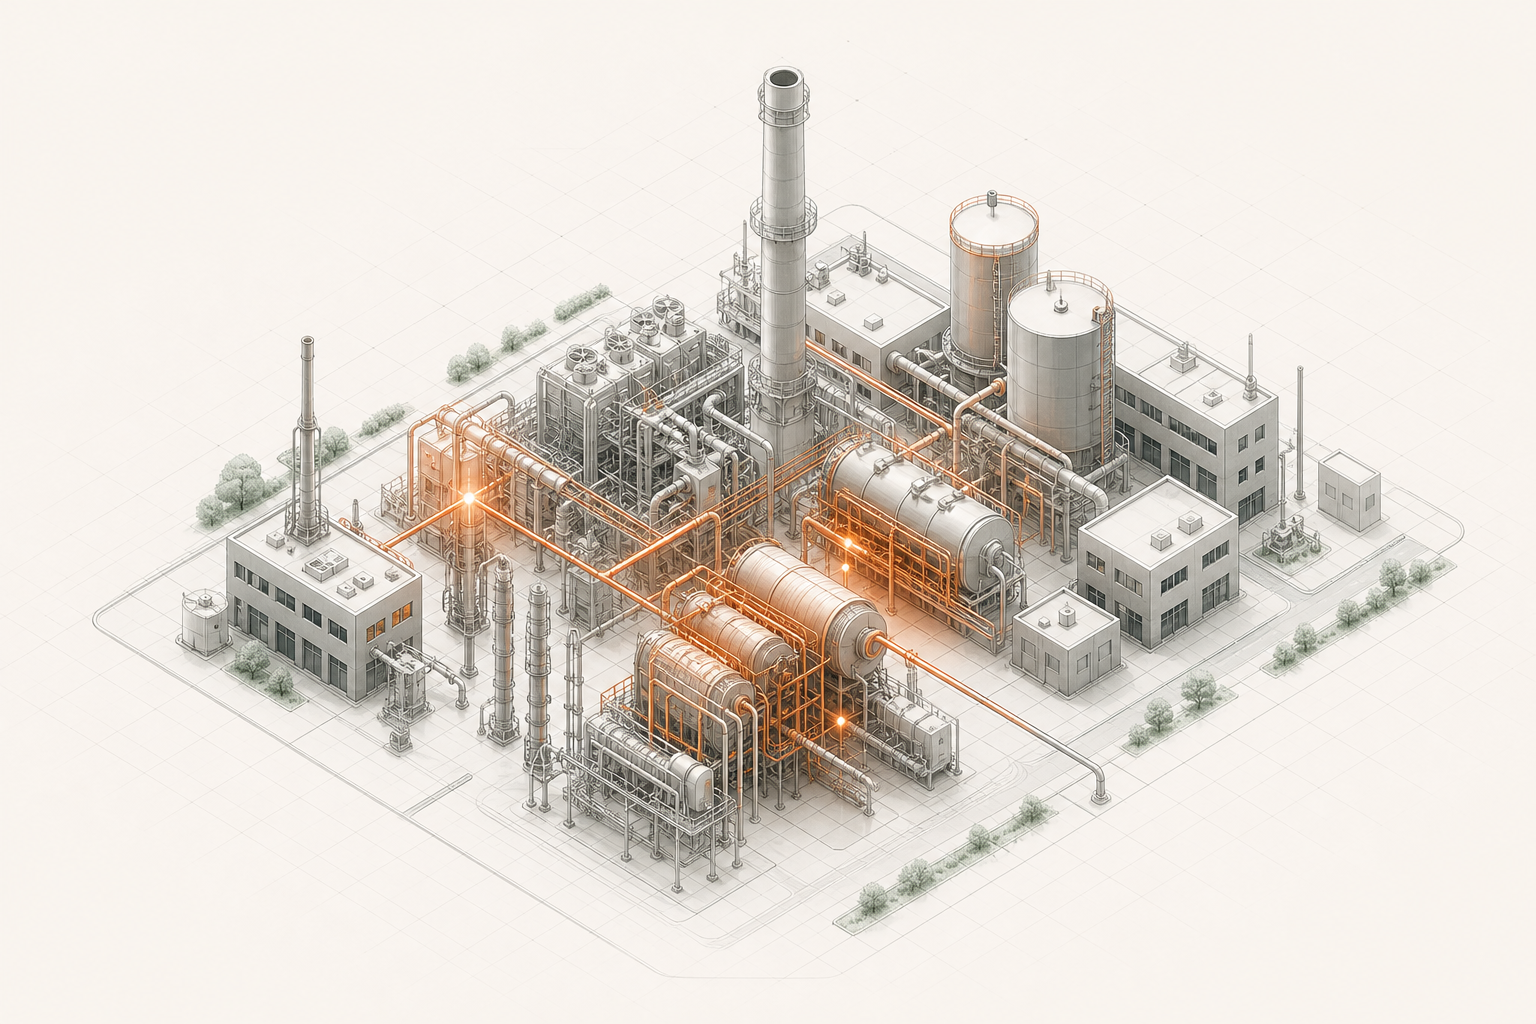
Boilers drift, heat exchangers foul, steam lines leak, and buried heating networks lose energy long before the damage appears in monthly reports. HeatOptx gives teams a live thermal view of where heat is escaping, what it costs, and which repair pays back first.
Small inefficiencies compound into major fuel waste.
Performance slowly drops while energy use climbs.
Heat loss travels across systems and production lines.
Decisions rely on guesswork, not fact.
HeatOptx makes hidden heat loss visible and actionable.
Thermal workflow
01 / MapHeatOptx Map turns boilers, pipes, heat exchangers, and process lines into a single thermal picture your team can act on.
Product suite
HeatOptx is designed for teams who need evidence, not another passive dashboard.
Visualize heat-loss intensity across boilers, pipe routes, exchangers, process lines, and district network segments.
Detect leaks, fouling, insulation failures, abnormal temperature drops, and efficiency drift before they compound.
Convert heat loss into annualized savings, payback period, CO2 impact, and ranked repair recommendations.
1Insulation repairEUR 152,300 / 4.2 mo
2HX cleaningEUR 98,700 / 6.1 mo
3Steam trap fixEUR 61,500 / 5.3 mo
View all actionsPlatform preview
The product view combines thermal maps, anomaly detection, repair economics, and integration status so cross-functional teams can agree on the next move.
 MapDetectROIReports
EUR 42k annualized loss, 3.8 month payback.
Solutions
HeatOptx adapts to the way your operation works across plants, networks, processes, and facilities.
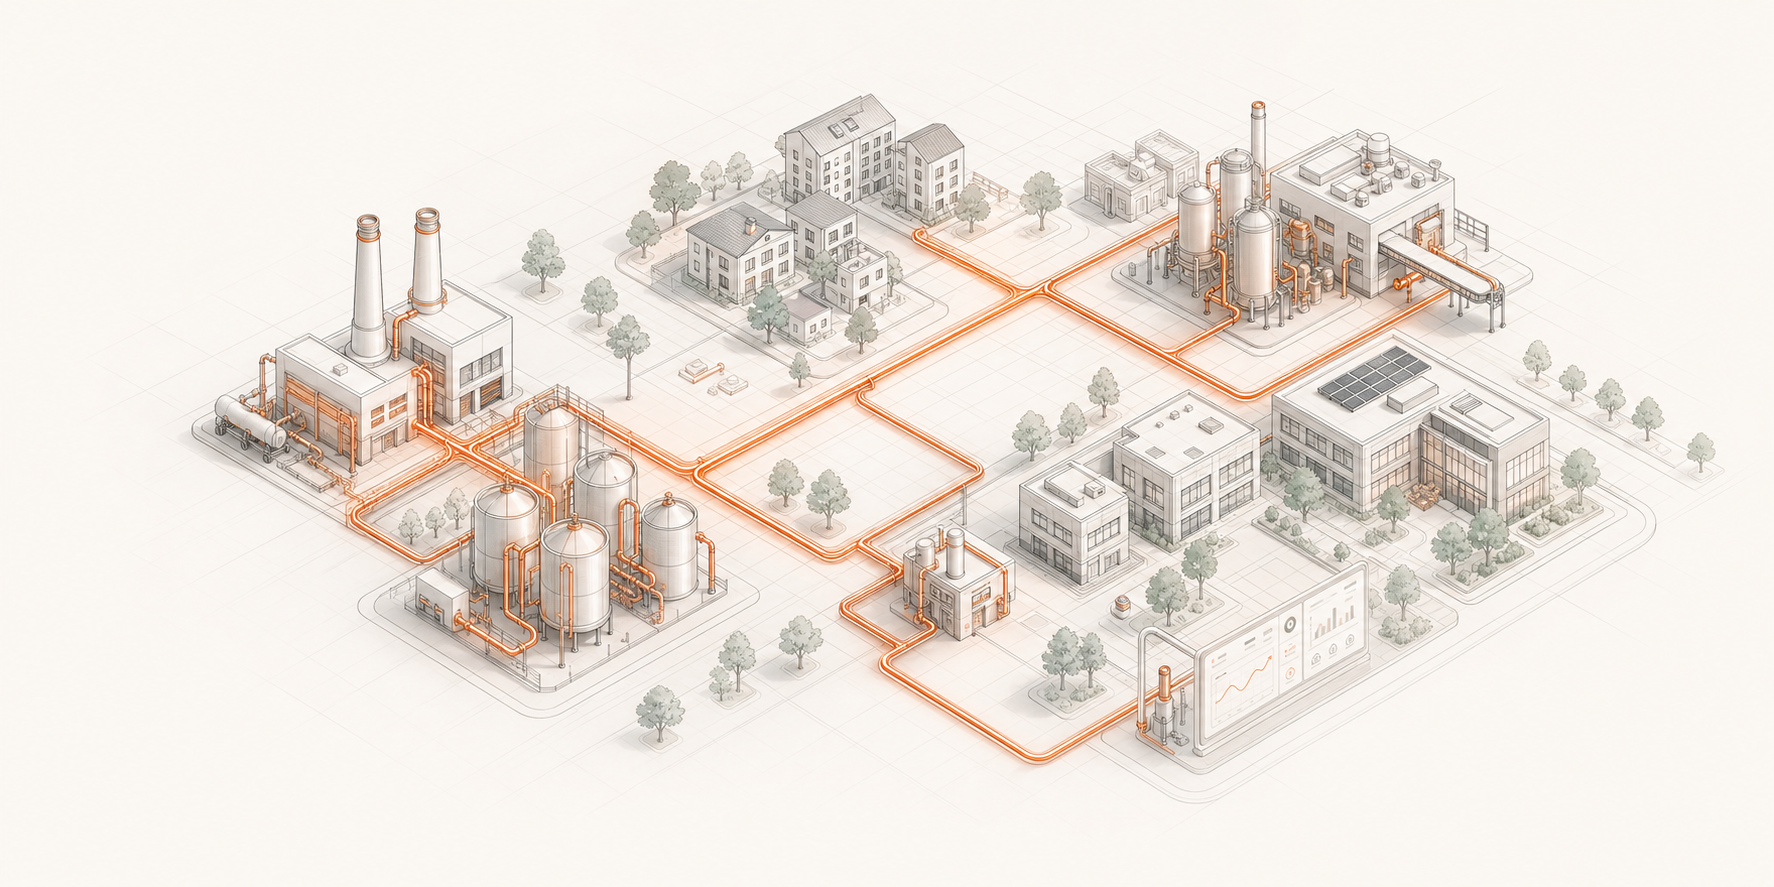
Track thermal loss around steam, hot water, compressed processes, and utility rooms.
Prioritize buried network segments, temperature drops, and service zones with rising losses.
Watch process heat, washdown, pasteurization, chilling, and recovery loops in one place.
Give maintenance, energy, and sustainability teams a shared thermal operating view.
Why teams use it
Make hidden heat loss visible across your systems.
Quantify cost, carbon, and operational consequence.
Rank fixes by ROI and payback with confidence.
Coordinate repairs and improvements across teams.
Measure savings, verify impact, and improve continuously.
ROI proof
HeatOptx packages each finding with the language decision-makers need: estimated loss, fix cost, payback, emissions impact, and confidence level.
Measure hidden heat loss with confidence.
Benchmark options and validate assumptions.
Prioritize fixes that deliver the highest impact fastest.
Communicate ROI, CO2 impact, and confidence clearly.
Align maintenance, energy, and leadership teams.
Pricing
Choose the package that matches your visibility needs today. Scale as your program grows.
One facility or network zone with ranked loss opportunities.
Map, detect, and ROI workflows for ongoing facility use.
Portfolio setup, integrations, governance, and reporting.
Request assessment
Share a few details about your plant, network, or facility portfolio. HeatOptx will respond with the right assessment path.


 Anomaly queuePrioritized issues
 Severity scoringRisk at a glance
 Cause hintsAct with confidence
 Repair rankingFocus on ROI


